Understanding Value in Texas Higher Education
Connecting What Students Study to What They Earn
Texas has made a clear commitment to ensuring that postsecondary education leads to meaningful outcomes. Through its strategic plan, Building a Talent Strong Texas, the state is working toward a goal of producing 550,000 Credentials of Value annually by 2030.
A credential of value represents more than completion. It reflects whether a program leads to strong earnings outcomes, a positive return on investment (ROI), and short- and long-term opportunities. This page brings together the tools, data, and resources Texas uses to define, measure, and provide transparency on value across higher education.
Explore Value in Texas: Key Resources
Texas provides multiple ways to examine how education connects to earnings, workforce outcomes, and short- and long-term opportunities. The Texas Higher Education Coordinating Board (THECB) leads this effort by integrating education data with workforce wage records provided by the Texas Workforce Commission, creating a comprehensive and transparent view of value across the state.
Credentials of Value
Defines how Texas measures value in higher education by linking programs to earnings, costs, time to completion, student decision-making, workforce needs, and state policy.
Community College Finance
Aligns community college funding with student outcomes by using credential of value, ROI, and the state median self-sufficient wage threshold to reward strong workforce results.

Data Bridge: Credentials of Value
Provides an interactive view of Texas programs that meet the state’s credential of value standard based on earnings outcomes and program-level data.

My Texas Future: Career Explorer
Helps learners, from 8th grade through adulthood, explore earnings by major, connect programs to careers, and understand job opportunities by field of study.
Postsecondary Employment
Outcomes (PSEO) Explorer
Provides earnings outcomes by institution, program, and degree level, including all Texas public two-year and four-year institutions, with private institutions forthcoming.

Texas CREWS Dashboard
Shows institution and program outcomes, including tuition, time to degree, loan debt, median first-year wages, wage match rates, and statewide comparisons.

THECB Accountability System
Provides public data on Texas higher education outcomes, including student loan debt, earnings, enrollment, completion, and post-completion employment.
Credentials of Value
Connecting Education to Earnings and Opportunity
A credential of value is a certificate or degree that leads to earnings outcomes that exceed both the cost of education and what a student would have earned with only a high school diploma.
The Framework
Total Student Investment
What it costs to earn a credential.
- Tuition and Fees
- Financial Aid
- Opportunity Cost
(earnings a student gives up while enrolled)
Base Comparison Wage
What a student would earn with only a high school diploma
- Based on median earning of Texas high school graduates
- Measured cumulatively over time
Post-Completion Earnings
What graduates actually earn after completing their credentials
- Based on Texas Workforce Commission wage data
- Measured annually for up to 10 years
Credential of Value
Achieved when cumulative post completion earnings exceed the total of the base comparison wage and the total student investment, and the graduate reaches a self-sufficient wage within the defined time period.
The Journey to Value: The Break-Even Point
Value is achieved when a graduate’s cumulative earnings surpass both the high school earnings baseline and their total investment in education.
Credentials of Value ensure that Education pays off.
Students gain skills. Texas gains a stronger workforce. Communities thrive.
Download a printable version.
The COV framework evaluates whether students:
- Recover their total investment in education, including opportunity cost
- Reach a self-sufficient wage within a defined period
- Outearn the high school baseline over time
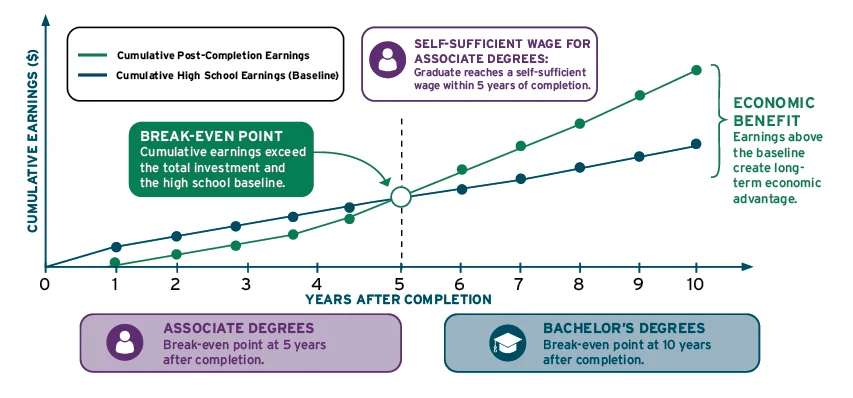
A key component of the methodology is the break-even point, illustrated in the graphic below. This represents the point at which cumulative post-completion earnings exceed both the high school earnings baseline and the total investment in education.
- For associate degrees, the break-even point is evaluated at the 5-year mark after completion
- For bachelor’s degrees, the break-even point is evaluated at the 10-year mark after completion
As shown in the visual, value is achieved when the earnings trajectory of graduates surpasses both the baseline and the total investment, demonstrating that the credential leads to sustained economic benefit.
This approach ensures that value is measured based on real economic outcomes, not completion alone.
Community College Finance
Texas redesigned its community college funding model in 2023 through House Bill 8 (88th Legislature) to focus on student outcomes rather than enrollment alone. The model ties state funding directly to results, including the completion of credentials of value, ensuring that institutions are incentivized to offer programs that lead to strong earnings and workforce outcomes.
The funding formula rewards colleges for:
- Credentials of value aligned with workforce demand
- Student completion and progression
- Successful transfer outcomes
- Dual credit attainment
By embedding value into the funding structure, Texas connects data to action. Institutions are supported and incentivized to align programs with workforce needs, improve student outcomes, and expand access to high-value pathways.
This approach represents a shift from funding based on inputs to funding based on outcomes, reinforcing the state’s commitment to ensuring that education leads to meaningful economic opportunity.
For additional data, forecasts, and program descriptions related to the funding model, users can refer to the THECB’s Funding webpage.
Data Bridge: Credentials of Value
Texas is raising the bar for its education goals. In addition to tracking how many Texans attain postsecondary credentials, we’re looking at whether their credentials will truly pay off for them in the future.
This site provides a statewide view of which programs deliver economic value by comparing earnings to the cost of education and a high school baseline. Data Bridge allows users to explore outcomes across degree levels and fields of study, enabling them to identify programs that deliver strong returns for students and the state.
My Texas Future: Career Explorer
My Texas Future provides a student-focused experience that connects careers to earnings, education, and workforce demand. The Career Explorer includes information on more than 1,000 careers across Texas and allows users to personalize their search.
Users can:
- Search careers by title, career cluster, or location
- Explore opportunities within specific regions or counties
- View median wages and annual salaries
- Examine projected job growth and demand
- Filter results based on salary availability and other preferences
- Compare careers side by side
- Save searches and favorite careers by creating an account
Each career profile provides detailed information, including:
- Median hourly wage and annual salary
- Projected growth and number of expected job openings
- Recommended education level
- Key knowledge areas and skills
Examples include high-demand careers such as wind turbine service technicians and nurse practitioners, which show strong earnings potential, significant projected growth, and clear education pathways in Texas.
This tool helps users understand how career choices connect to earnings and what level of education is needed to reach those outcomes.
Postsecondary Employment Outcomes (PSEO) Explorer
The Postsecondary Employment Outcomes (PSEO) data provide a national view of earnings and employment outcomes for graduates. Developed by the U.S. Census Bureau, PSEO links postsecondary education records with a national database of jobs to produce reliable, privacy-protected insights.
In Texas, this tool can be used to examine outcomes across all public two-year and four-year institutions, allowing users to explore earnings and employment results at scale while also comparing programs and institutions nationally.
PSEO data allow users to examine outcomes by:
- Degree level
- Field of study
- Institution
- State
These data are created through partnerships between universities, state education agencies, labor market information offices, and the U.S. Census Bureau. All data are processed using advanced confidentiality protections to ensure individual privacy.
Users can explore:
- Earnings at multiple points after completion
- Employment outcomes and workforce participation
- Comparisons across institutions, programs, and states
Public-use datasets are also available for download and include:
- Comprehensive national datasets covering all participating institutions
- State-level datasets focused on institutions within a specific state
PSEO strengthens Texas’s approach by providing both statewide coverage and national comparability, allowing users to examine outcomes across all public institutions in Texas while benchmarking results against
TX Crews Dashboard
The Texas CREWS Dashboard connects education to workforce outcomes by allowing users to compare earnings, employment, and student outcomes across programs and institutions. Developed in collaboration between the THECB and the Texas Workforce Commission, it provides a statewide view of how students perform after completing their credentials.
Users can:
- Compare outcomes across all public two-year and four-year institutions in Texas
- Examine median wages, student loan debt, and employment outcomes
- Analyze differences by major, program, institution, and credential level
- Explore how outcomes vary across regions and fields of study
By linking education data with workforce wage records, CREWS shows how programs translate into real-world outcomes. This helps users understand variation across Texas, identify stronger-performing programs, and better align education choices with workforce opportunities.
THECB Accountability System
The THECB Accountability System provides publicly available data that allows users to examine outcomes across all public two-year and four-year institutions in Texas. These reports support transparency by connecting education to earnings and post-completion activity over time.
Users can explore several topics:
- Student Loan Debt to Earnings
- Compare student loan debt to median first-year wages after completion
- Evaluate return on investment across programs and institutions
- Post-Completion Outcomes
- Number of students who are:
- Enrolled only.
- Working only.
- Both enrolled and working.
- Outcomes are measured one year after receiving a credential.
- Number of students who are:
- Historical Trends
- Access data for the past 10 years
- Examine changes in outcomes over time across institutions and programs
These reports provide a consistent, longitudinal view of how students perform after completion, helping users assess outcomes, identify trends, and better understand the relationship between education, earnings, and continued enrollment.